KPI scorecards
Targets versus actuals with clear colour-coded status.
See what matters in your business at a glance, updated automatically.
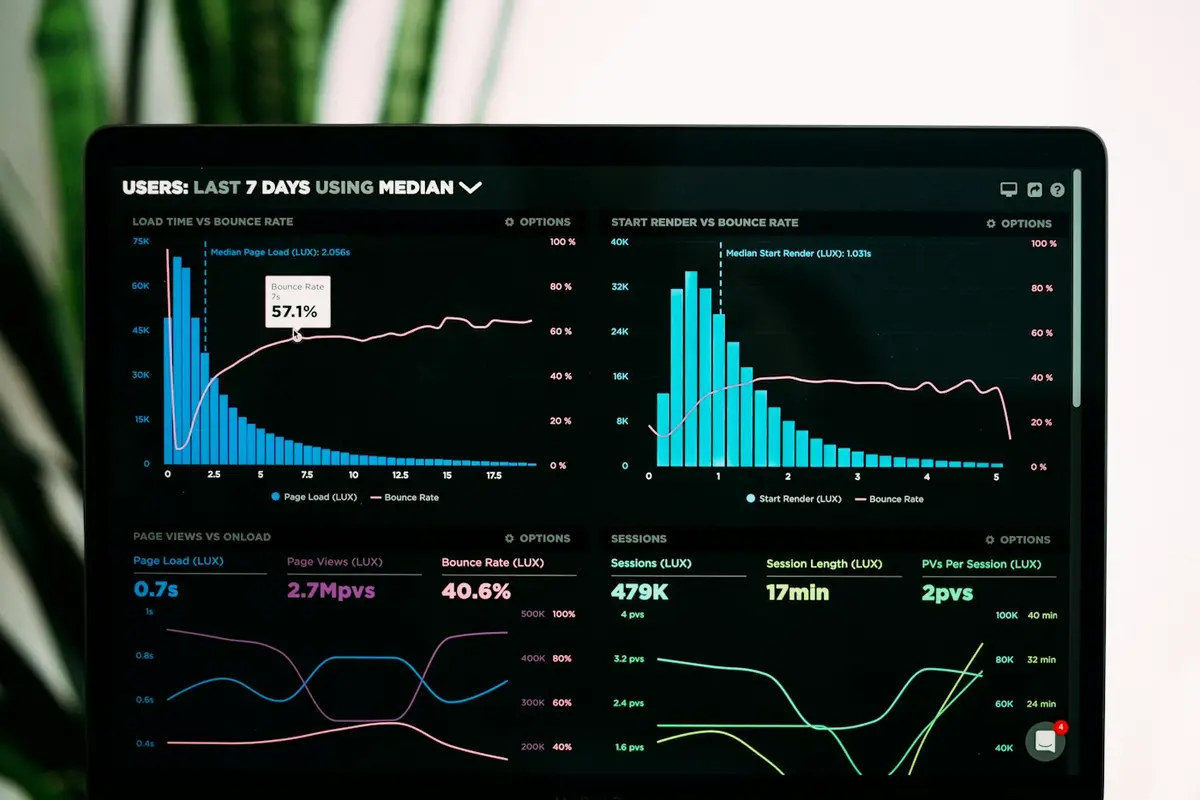
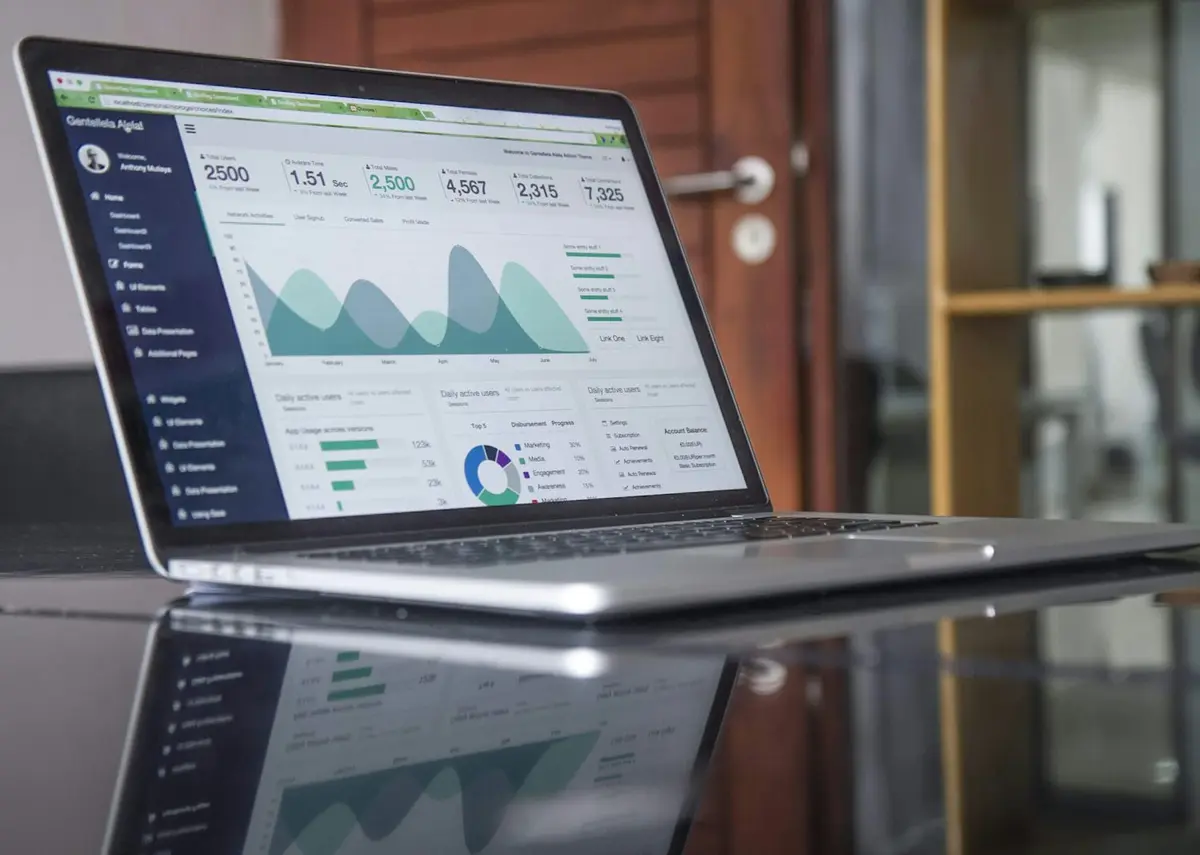
Managers shouldn't wait for spreadsheets to know how the business is doing. We build interactive dashboards that pull live data from your systems and show KPIs, trends and exceptions on one screen, on desktop or phone.
Filters, drill-downs and alerts let every role, from the plant floor to the boardroom, see exactly the numbers they are responsible for.
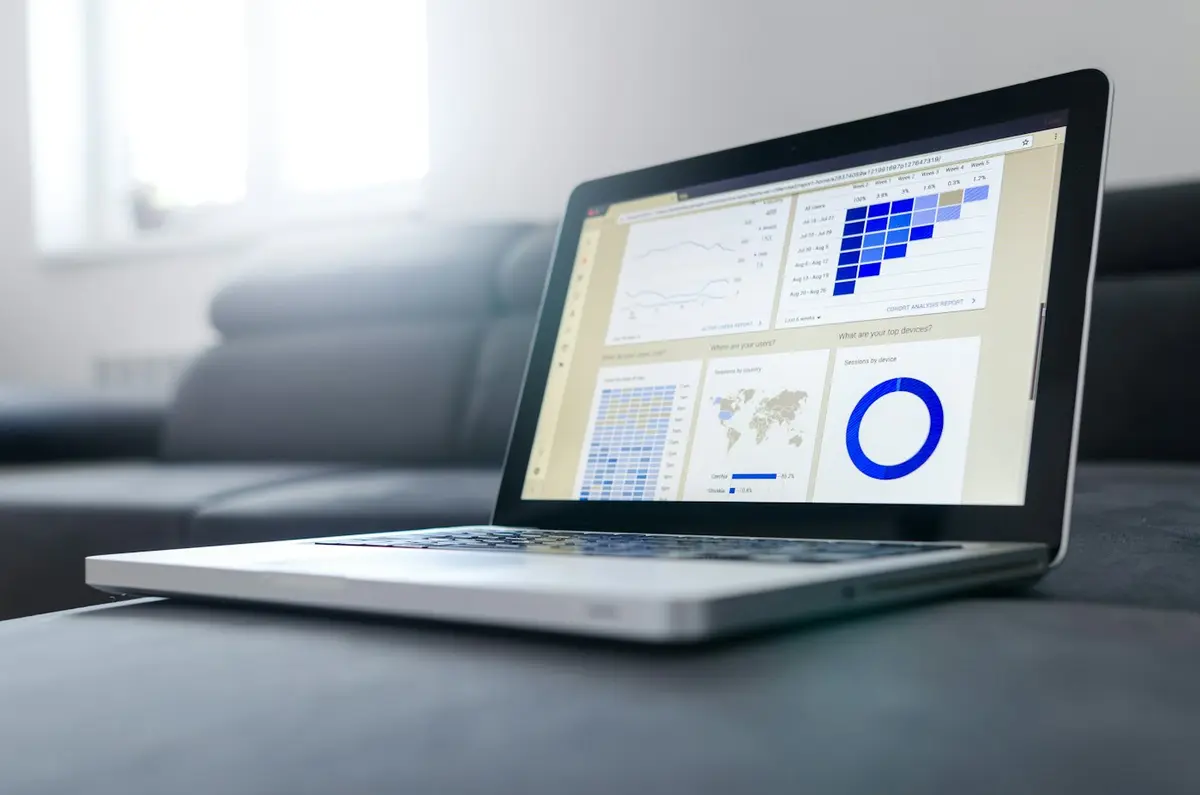
Targets versus actuals with clear colour-coded status.
Slice by date, location, product or team and click into details.
Scheduled or real-time data refresh from your databases.
Email or in-app alerts when a number crosses a threshold.
Each user sees only the data and screens they need.
Download to Excel or PDF and share scheduled reports.
We pick the stack that suits your team, budget and existing systems.
We study your business, users and current systems.
We plan architecture, screens and integrations with you.
We develop in short iterations you can review and test.
We deploy, train your team and keep improving.
Yes. We connect directly to SQL Server, Oracle, PostgreSQL, MySQL or Excel and API sources.
Yes, dashboards are responsive and work in any modern browser on phone or tablet.
Yes. We recommend the right option for your budget and users, and can build either.
Share your requirement and we'll reply within one business day with next steps.
Reports, trends and visual insights that support smarter decision-making.
Connect and sync databases and platforms into one reliable source of truth.
Modernise legacy systems and migrate data safely with minimal disruption.